Loading, please wait.
After three weeks of humidity measurement, Azure data shows the following behavior:
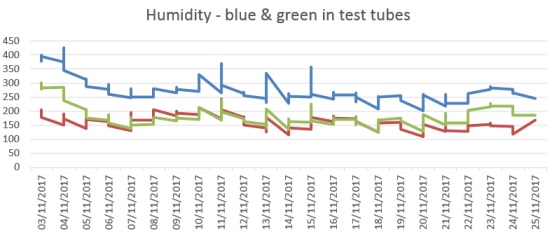
I expected to see straight lines for sensors blue and green as they are in test tubes.
The measurement is not random though because:
1 - The fully immerged sensor (blue) gives higher values than the half immerged (green).
2 - Green and blue follow exactly the same pattern
3 - Red sensor which is in a pot, shows similarities in its evolution.
I copied local temperatures history from the same period from the Web and compared the two graphs on a day per day basis:
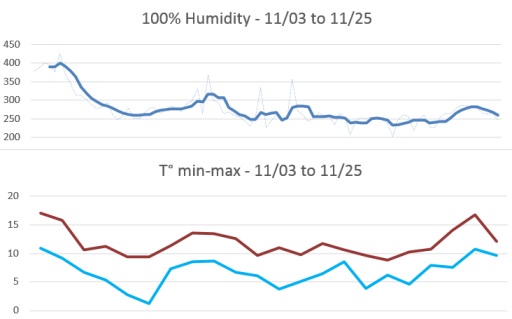
It is obvious that my "sensor in a test tube" is a pretty good thermometer!!
In order to know the humidity of my pots, I need to correlate sensors information with local temperature and add some filtering mechanisms.
I added a DHT11 Temperature and Humidity sensor to the Azure Watering system (another option would be to get it from the cloud...)
Now my Azure watering system has been running for a few weeks and I can use collected data to undestand how it behaves.
The data on Azure lead to the following graphs:
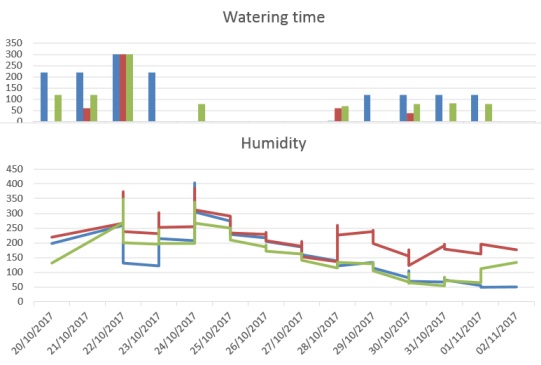
The big watering bars correspond to manual watering, from this graph I understand several key points:
1 - Humidity level should be maintained between 50 and 300
2 - Cooler temperatures in November have minimized evaporation ...or plants consumption
3 - The humidity variation during a day may be important compared to the interval given before
4 - All humidity sensors seem to follow an identical pattern, but my pots are not identical!!
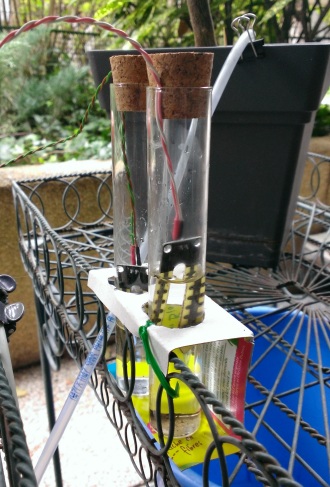
To know more about humidity Sensors, i will modify the configuration, two sensors will be installed in test tubes, one completely immerged and the other one half immerged .
With this 100% stable configuration and Azure data recording, I expect a clarification on humidity measurement.
My Azure watering system did work by itself during my vacation, and thanks to Azure recorded data I know a bit more about humidity and watering.
The data history shows an unexpected behavior:
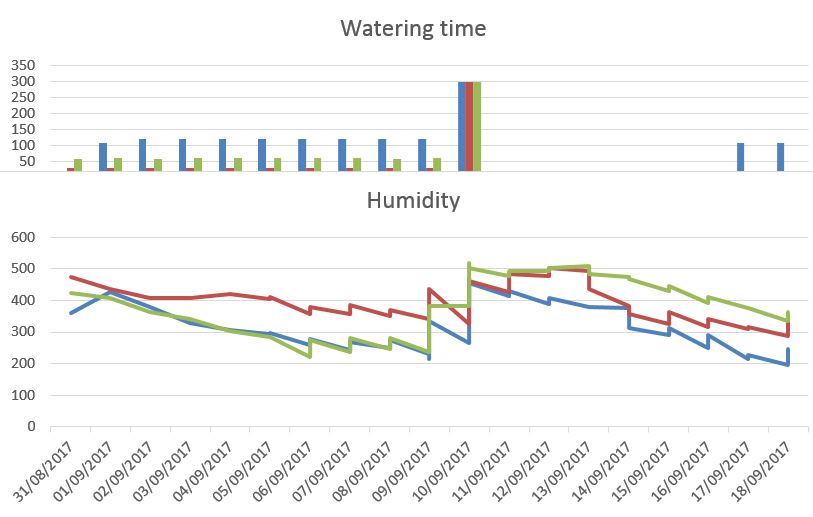
Water has been pumped everyday in the pots without raising the level of humidity, the big bars on september 10th (300) correspond to manual watering. I also noticed that water was spilled under the pots, meaning that it was going through the soil - totally inefficient!! Also the correaltion of Azure data with real world showed that a humidity level of 200 was perfectly suitable for my trees.
Now I'm ready to modify the program and watering plan:
1 - I must be able to control the levels and timings remotely, I added a "parameter" table in Azure
2 - I must make four measures per day because humidity values shown are unstable
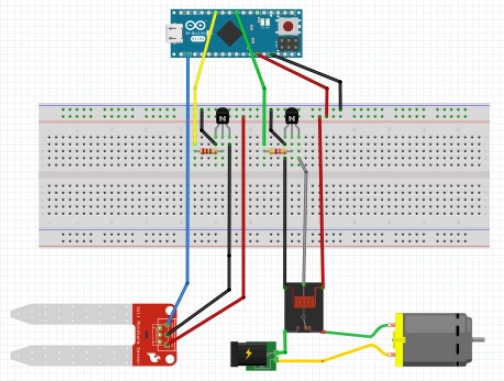 Before my summer vacations, I decided to build a watering system for my decorative trees. The soil moisture is measured with a cheap IoT sensor and the water supply uses 12V airpumps pushing air in water bottles (this makes a safe separation between electric and water circuits), the electronic schema is as follows:
The 86Duino Educake computer monitors the humidity level once a day and will pump water if the level is too low, it sends data to Azure therefore I'll be able to see how things are going on...
Following a cat's activity is not an easy task, Azure Mobile Services makes it possible with the help of a dedicated intelligent IoT system and REST appications.
In December 2013, DMP released new platforms based on the Vortex86 architecture and compatible with the well known Arduino programming model. I ordered one of these platforms and made my first tests during the week end.